Portfolio Details
Daily Sales Dashboard
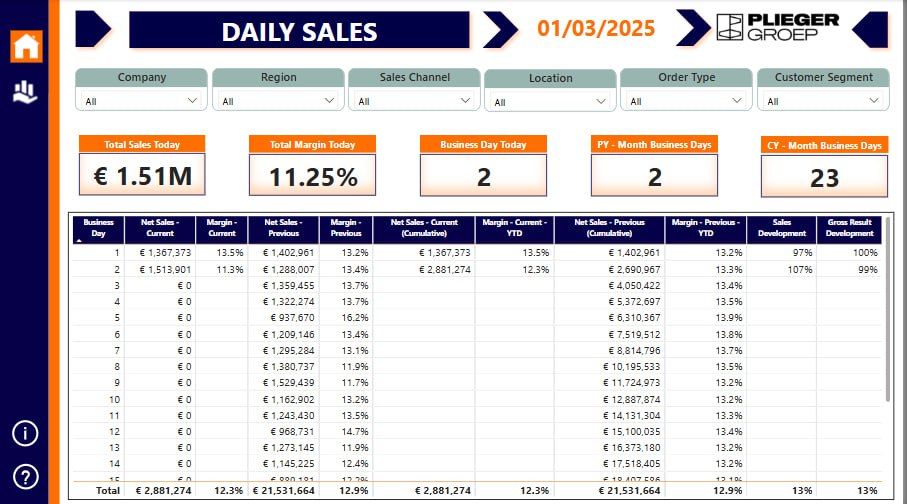
1. Overview of Key Metrics
- Total Sales Today (€): The total net sales achieved for the current business day, providing an immediate snapshot of daily revenue generation.
- Total Margin Today (%): Displays the margin percentage for the current day's sales, helping to evaluate profitability.
- Business Day Today: Indicates the count of business days in the current month, essential for tracking month-to-date progress.
- PY - Month Business Days: The number of business days in the same period last year, enabling year-over-year sales performance comparison.
- CY - Month Business Days: The total number of business days in the current month, providing a reference for business day tracking.
2. Year-on-Year Comparison of Sales and Margin
The dashboard enables year-over-year comparisons of net sales and margins, helping to analyze performance trends.
- Net Sales - Current Year: Displays net sales for each business day in the current year, providing a granular view of revenue trends.
- Net Sales - Previous Year: The corresponding net sales values for the same business days in the previous year, allowing direct comparison.
- Margin - Current Year (%): Shows the profit margin for each business day in the current year, ensuring transparency in profitability analysis.
- Margin - Previous Year (%): Displays last year's profit margin, enabling businesses to track margin fluctuations over time.
- Cumulative Net Sales & Margin (YTD): The dashboard also presents cumulative sales and margins for the year-to-date period, helping businesses gauge overall financial performance.
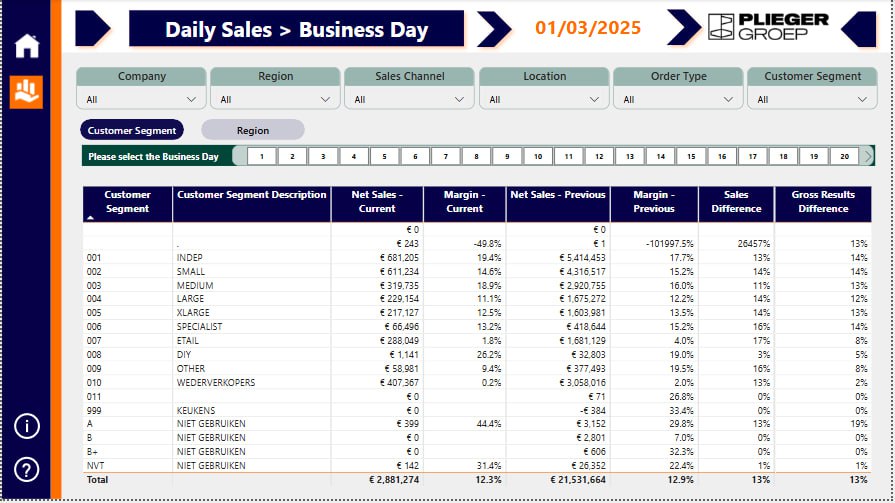
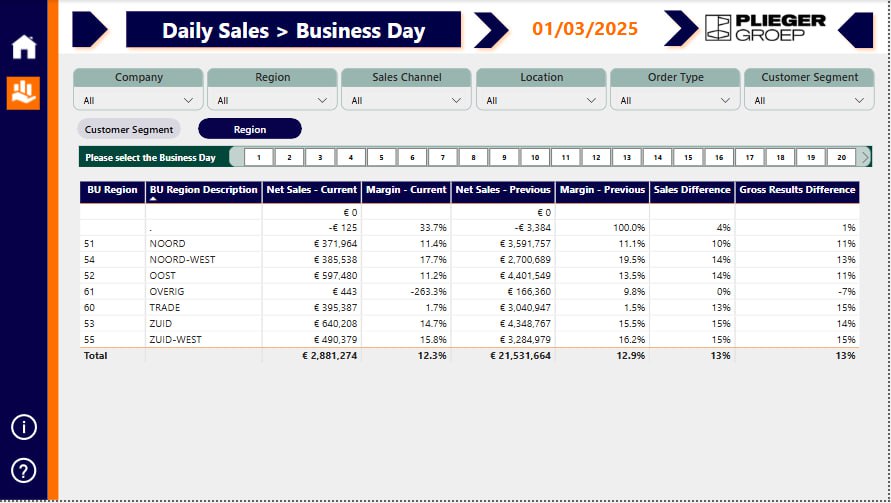
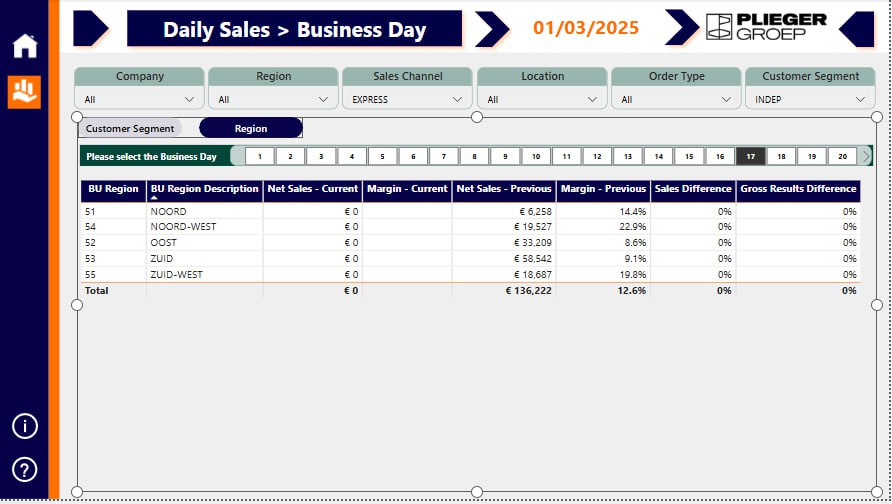
3. Business Unit & Customer Segment Breakdown
- Customer Segment Analysis: The dashboard categorizes sales by different customer segments, helping businesses understand which segments are driving revenue growth.
- BU Region-wise Revenue: Sales data is segmented by Business Units (BU) across different regions, offering insights into regional performance variations.
4. Dashboard Features & Benefits
- Dynamic Filtering: Users can filter data by Company, Region, Sales Channel, Location, Order Type, and Customer Segment, allowing tailored insights.
- Business Day Analysis: Provides a structured view of sales performance for each business day, making it easier to track trends over time.
- Interactive Visuals: Users can drill down into specific metrics to analyze trends at a granular level.
- Performance Benchmarking: The year-over-year comparison helps in setting realistic sales targets and identifying performance gaps.
- Enhanced Decision-Making: By offering clear insights into daily sales trends, the dashboard empowers businesses to optimize sales strategies and improve profitability.
This Daily Sales Dashboard is a powerful tool that provides a structured and data-driven approach to monitoring sales performance, helping businesses stay competitive and make informed decisions based on real-time data.